

The Life Cycle of a New Neighborhood
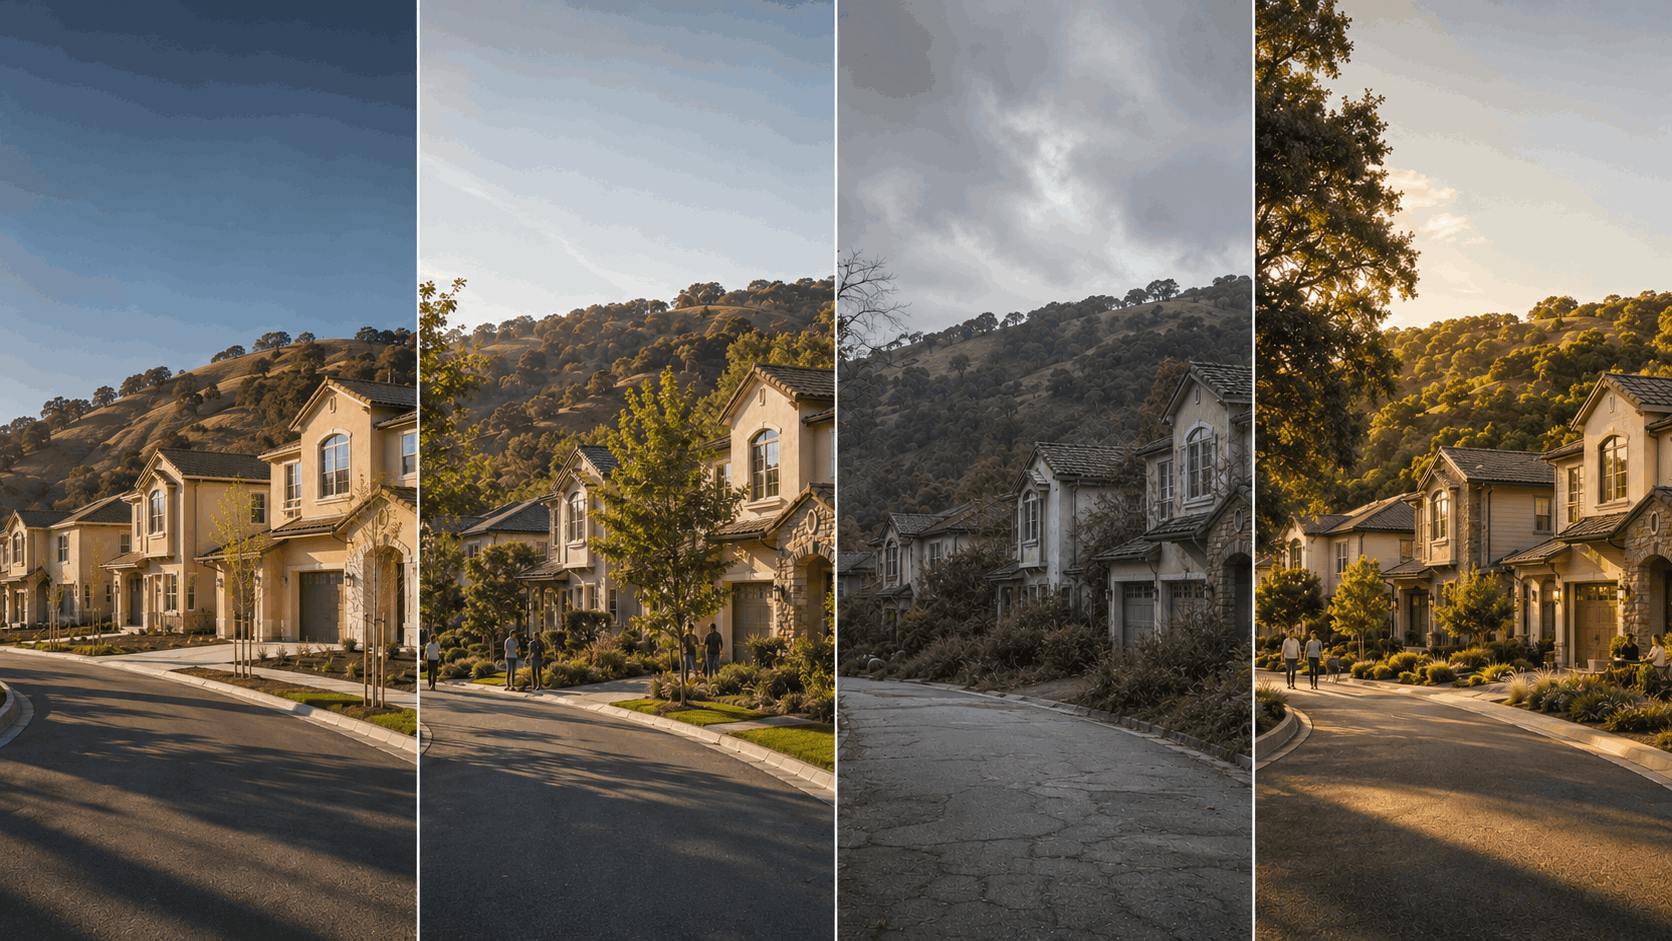
When every home is built at roughly the same time, every roof, floor plan, landscape and finish begins aging together.
New subdivisions are sold as a vision of the future: pristine homes, fresh streets, tiny new trees and the promise of a beautiful community taking shape. But they contain a built-in vulnerability. Because nearly everything is constructed at once, nearly everything begins aging at once.
For years, that synchronized timeline is an advantage. Trees fill in. Neighbors put down roots. The community earns a reputation and often a market premium. Then the clock catches up. Roofs, windows, mechanical systems, exterior paint, kitchens, bathrooms and landscaping can all reach their decision point within the same chapter.
A neighborhood rarely loses its premium in one cinematic crash. It happens quietly. Yesterday’s finishes become today’s “project.” Buyers stop seeing move-in-ready homes and start calculating renovation budgets before they have even walked through the front door.
Then one sale closes at a price that reflects that work. Another follows. If those homes are truly comparable, those transactions become part of the market evidence appraisers and buyers must consider. The story of the neighborhood can begin to change—not because the people stopped caring, but because the houses stopped keeping pace with the market.
The four phases of a subdivision’s life cycle
Real-estate theory commonly describes a progression from development and growth through stability, possible decline and eventual renewal. The year ranges below are illustrative—not appraisal standards or a guaranteed price trajectory. Climate, construction quality, owner maintenance, market conditions and reinvestment can shorten, extend or entirely reshape a phase. Some communities remain stable for generations; others begin renewing before decline takes hold.
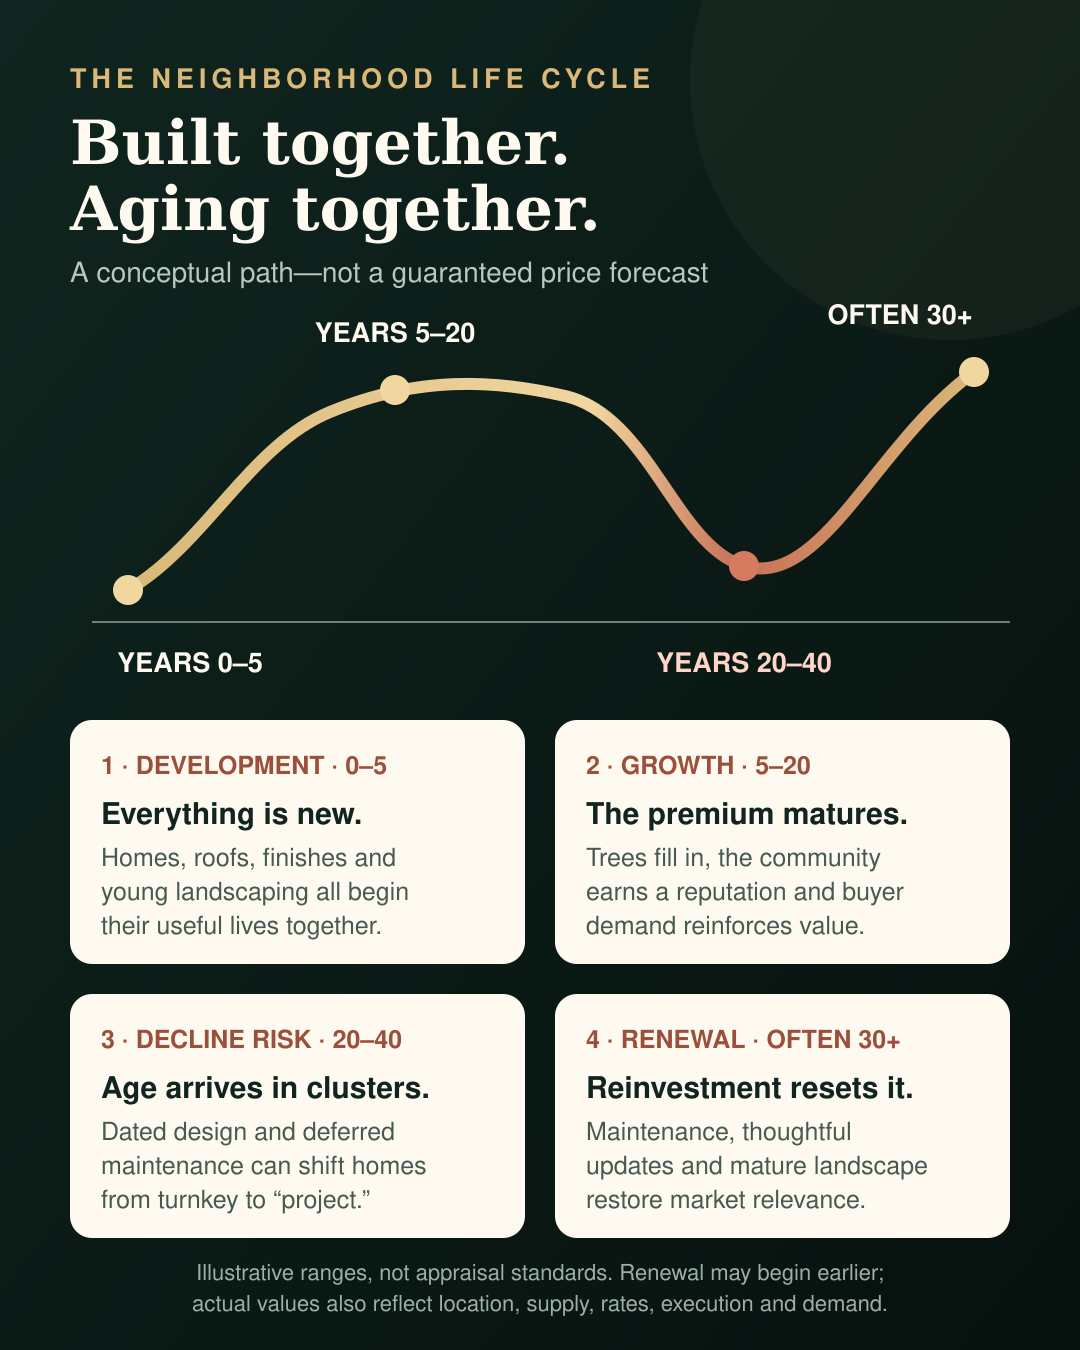
1. Development — approximately years 0–5
The streets are new and the landscaping is sparse. Young trees and shrubs have not yet softened the architecture, but the homes offer contemporary layouts, untouched systems and little deferred maintenance. Builder marketing and the appeal of “brand new” can create immediate demand.
2. Growth and stability — approximately years 5–20
Trees grow, gardens fill in and the neighborhood begins to look established rather than unfinished. Community identity strengthens. Owners personalize their homes, amenities mature and positive resale history can reinforce the neighborhood’s reputation. This phase may continue far longer when maintenance and selective updating keep pace with buyer expectations.
3. Maturity and decline risk — approximately years 20–40
This is a decision period, not an automatic collapse. Decline does not have to mean boarded windows or abandoned streets. In a desirable community, it may be far subtler: mature landscaping becomes overgrown, roofs and exterior finishes tire, floor plans feel less current, and multiple listings begin carrying the same renovation burden. Buyers start using words such as “potential” and “project” instead of “turnkey.” Consistent upkeep can hold this risk at bay.
4. Renewal — often beginning around year 30 or later
Renewal is triggered by reinvestment, not a birthday, so it can overlap the prior phase or begin much earlier. Maintenance and thoughtful modernization restore relevance without erasing the character that made the neighborhood desirable. Mature trees are professionally managed, homes are refreshed, obsolete layouts and systems are addressed, and useful new space may be added. The neighborhood keeps its roots while regaining its competitive edge.
The value gap is real
A peer-reviewed study of urban housing transactions found an average premium of roughly 5–7% for fully renovated dwellings and an average discount of roughly 9–10% for unmaintained or neglected dwellings, after controlling for other characteristics. Its central estimates—+5.7% and −9.2%—create a 14.9-percentage-point condition gap.
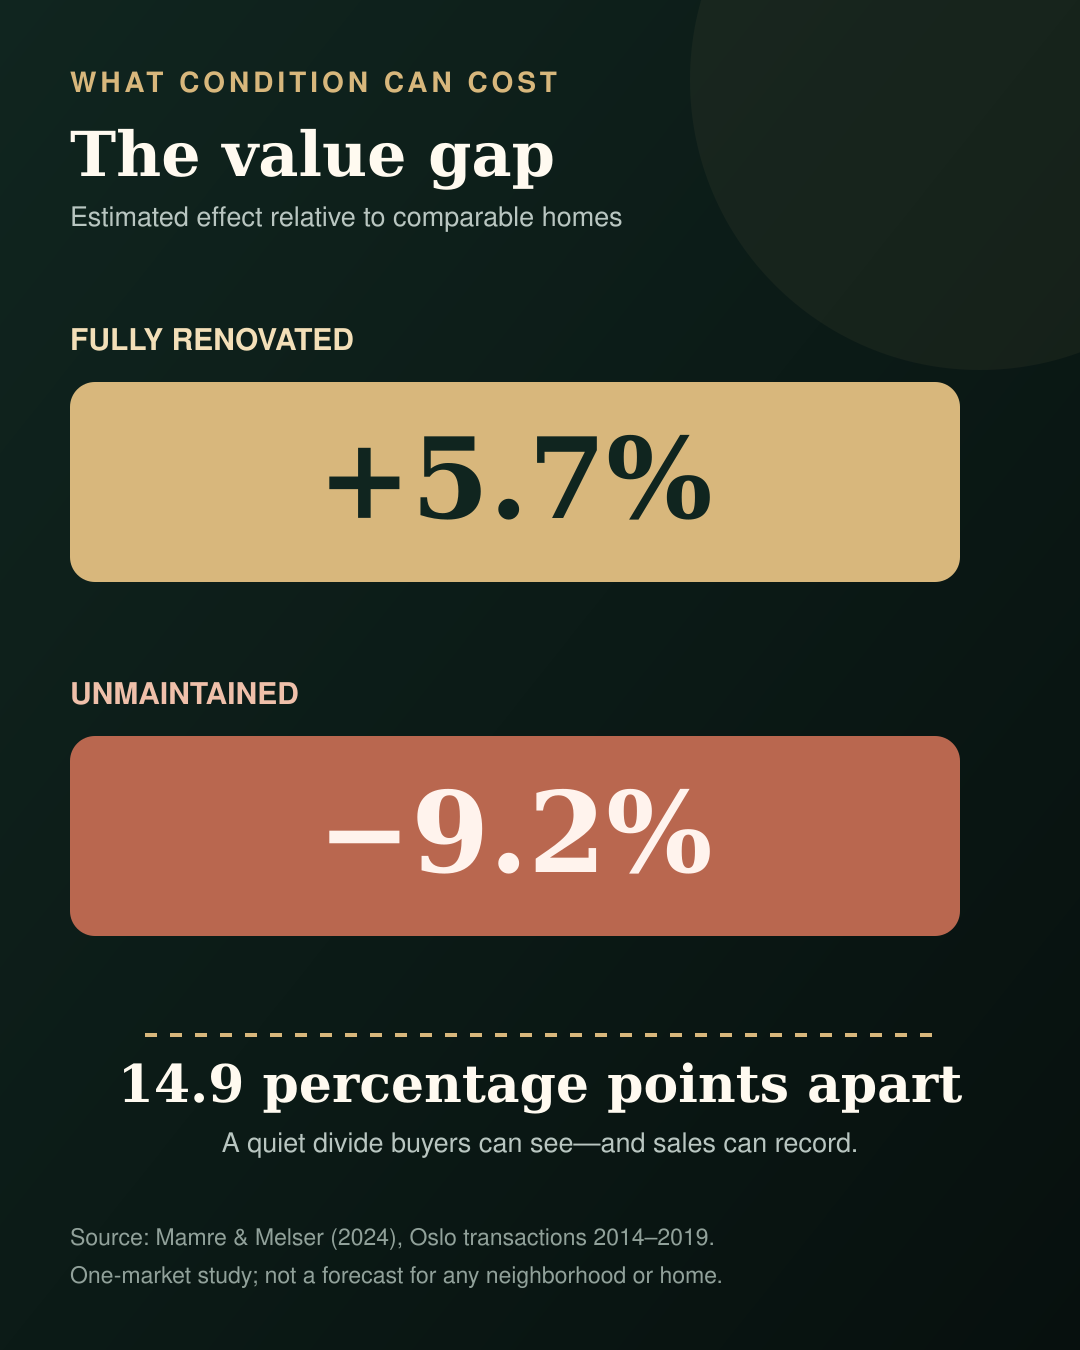
That does not mean every renovation automatically adds 5.7%, or that every dated home loses 9.2%. The study covered one market and one period. Value depends on location, execution, buyer demand and whether the work is appropriate for the home. But the direction of the finding is hard to ignore: condition changes the price conversation.
Current appraisal guidance reinforces why the conversation can spread beyond one property. Fannie Mae requires appraisers to analyze the most recent and similar closed sales, contract sales and listings, and to support neighborhood value trends with factual market data. One low sale does not mechanically reset every home’s value—but a pattern among genuinely comparable homes can become evidence buyers, agents and appraisers cannot simply wave away.
What the local MLS data can—and cannot—tell us
BAREIS MLS data offers a timely reminder that a headline median is not the same thing as a value trend. In Novato’s single-family market, 135 homes closed in Q2 2026, up 11.6% from the same quarter in 2025. The citywide median sale price fell 2.6%, from $1,335,000 to $1,300,000. Yet the median price per square foot increased 0.5%, from $623 to $626, while median days on market held at 21.
Those figures do not prove that values were declining. They show that the mix of homes sold changed. BAREIS-based analysis found three different patterns within Novato’s ZIP codes: median price per square foot rose 5.7% in 94945, remained essentially flat in 94947 and stayed flat in 94949. The lesson is important: a citywide median can move simply because smaller, larger, less expensive or more expensive homes made up more of that quarter’s sales.
BAREIS’s official Marin County report shows similar month-to-month movement that should not be mistaken for a neighborhood life-cycle verdict. Across residential property types, 276 properties sold in July 2026 at a $1,450,000 median and 28 median days on market, versus 233 sales in June at a $1,606,000 median and 22 median days. Those numbers describe the transactions that occurred; they do not isolate age, renovation level or subdivision condition.
To determine whether a particular subdivision is moving from stability toward decline—or into renewal—the meaningful analysis must go deeper: comparable homes within the same competitive area, segmented by condition, renovation quality, lot and location, studied over enough time to separate market movement from a changing sales mix.
Adding value does not mean chasing every trend
The smartest reinvestment is rarely the loudest. It protects the bones of the property, removes the most visible signs of age and aligns the home with how people live now. The 2025 National Association of REALTORS® remodeling research found that agents most often recommended whole-home painting and roofing before sale; it also found rising buyer demand for kitchen upgrades, roofing and bathroom renovations. Smaller exterior improvements can matter too: the report estimated full cost recovery for a new steel front door, though returns vary by project and market.
A practical renewal hierarchy
- Protect: roof, drainage, exterior envelope, windows, mechanical systems and deferred repairs.
- Refresh: paint, lighting, hardware, landscaping and the first impression from the street.
- Modernize: kitchens, baths, flooring and layouts where the existing design creates real buyer resistance.
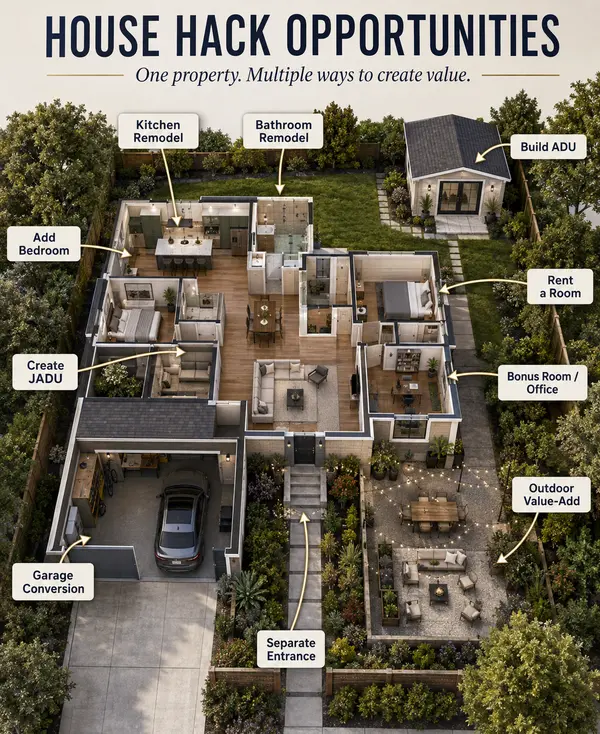
- Add utility: flexible work space, aging-in-place improvements, outdoor living or an appropriately designed and permitted ADU.
- Coordinate: preserve the neighborhood character that created the premium in the first place.
Not every homeowner needs a major remodel. Not every project returns its cost. And no one should spend based on a generic national percentage. The right first step is understanding which improvements the local market is rewarding now—and which forms of deferred maintenance are creating the biggest discount.
About Jory Bergman Killian
Jory brings together real-estate market knowledge with hands-on experience in property investment, design, development and hospitality. She helps homeowners look beyond generic renovation advice to understand how buyers may respond to a property’s condition, which improvements could strengthen its market position, and when preserving character may be more valuable than chasing a trend.
For a practical, market-informed analysis of your property—including what to update, what to preserve and which improvements may strengthen its future marketability—click below to schedule your Home Marketability Session with Jory.
Sources and context
- Mamre, M. O., & Melser, D. (2024). “Coming of Age: Renovation Premiums in Housing Markets.” Journal of Real Estate Finance and Economics. The study used Oslo transactions from 2014–2019; findings should not be treated as universal or applied directly to an individual property.
- Fannie Mae Selling Guide. “Neighborhood Section of the Appraisal Report.” Current guidance calls for fact-based analysis of competitive properties and at least 12 months of data when reporting neighborhood property-value trends.
- National Association of REALTORS® & National Association of the Remodeling Industry. 2025 Remodeling Impact Report.
- Strong Towns. “Who Benefits From Neighborhood Improvements?” A useful visual explanation of the cycle from development through stagnation and reinvestment.
- Minne Lusa. “The Life Cycle of a Neighborhood.” A narrative comparison between human aging and neighborhood development that offers example—not standardized—age ranges. This article uses simplified, overlapping ranges to fit the four-phase framework.
- Bay Area Real Estate Information Services. Marin County Two-Month Closed Sales Report: June and July 2026. Residential property types include single-family homes, condos/co-ops, farms and ranches, mobile homes and floating homes.
- Imagine Marin. Novato Housing Market Report: Q2 2026. Analysis based on BAREIS MLS closed single-family detached sales, including sold-off-MLS transactions.
This article is educational commentary, not an appraisal, guarantee of value, investment advice or recommendation to undertake a specific improvement. Market response, construction cost, permitting and resale return vary. Verify local requirements and obtain qualified financial, tax, design and construction advice before acting.
Categories

GET MORE INFORMATION